
Some Observations From the Front Line of Climate Change
Robert H. Rich, Ph.D., CAE
Executive Director, Arctic Research Consortium of the United States (ARCUS)
It has been said that the Arctic region is among the front lines impacted by a changing climate,[1] that the Arctic is the “canary in the coal mine”[2] for global changes, and that what happens in the Arctic doesn’t stay in the Arctic.[3] Because of Arctic amplification of temperature increases,[4] the rise in Arctic near-surface air temperatures has been almost twice as large as the global average in recent decades.[5] Connected with this, significant reductions in Arctic sea ice[6], land ice (particularly in the Greenland ice sheet)[7], and permafrost[8] have been observed in recent years. These changes are having a profound impact on Arctic ecosystems, and have led to a range of local and global impacts.

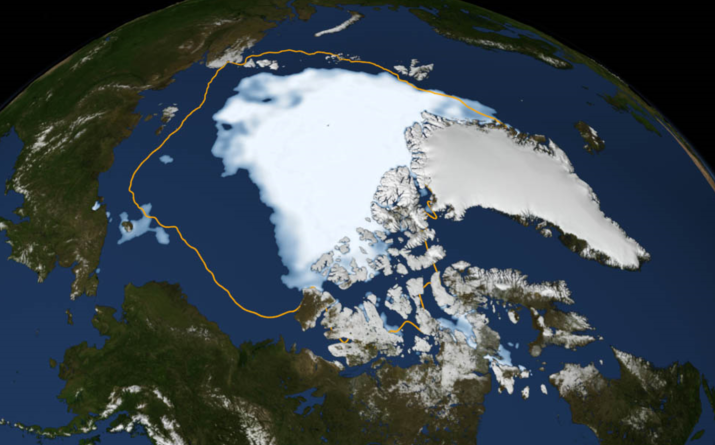
Fig. 1 Satellite data show that over the past 30 years, Arctic sea ice cover has declined by 30 percent in September, the month that marks the end of the summer melt season. Source: National Snow and Ice Data Center, 2015
How this looks on the ground, and what can be tied to the broader effects of environmental change, was a primary focus of my inaugural trip to the Arctic in June 2015 as a member of the University of Alaska, Fairbanks field course on “Arctic Alaska Environmental Change”[9] along the length of the Dalton Highway,* and subsequent visits to Nome and Barrow, Alaska. The primary challenge in attributing specific observable phenomena to climate change is that many of these have been occurring to some degree for a long time, and may be influenced by a range of factors, even if they likely would be exacerbated by a warmer climate. Nonetheless, this paper records images and anecdotal experiences that could well be substantially derived from the changing climactic parameters noted above.

Fig. 2 Ice on the Dalton Highway
One major event representing substantial change was the ice overflow across the Dalton Highway that took place in April 2015.[11] This significant change in the flow of the Sagavanirktok River shut down traffic along the road, cutting off the main supply route for Prudhoe Bay’s extensive petroleum operations for days. In some locations, ice on the road was more than two feet deep. Several sections were completely washed out, including where the river first flowed over the road and where it flowed back to the riverbed several miles downstream. In fact, repairs were still proceeding when we arrived on the scene on June 21.
On the other extreme, an aufeis† event near Galbraith Lake essentially disappeared between 2012 and 2015. These photos show the same valley and viewpoint at both timepoints.

Fig. 3 Where did the aufeis go?
Changes in the distribution of ice overflows and related aufeis events can be traced to a variety of factors, including topography, hydrology, permafrost/ active layer changes, and many others. Yet, these dramatic changes do indicate the dynamic nature of these Arctic river and stream environments.
Another observed change, which may more directly result from climate change, was the observed lack of visible sea ice from Prudhoe Bay on June 23 and from Barrow on August 27.

Fig. 4. Declining landfast sea ice
My observations were consistent with the longer-term trend of declining sea ice observed.[12] Also, real-time and historical views of Barrow sea ice can be accessed online.[13]
This decline in sea ice also increases the vulnerability of communities to fall storms through a combination of permafrost-thaw accelerated coastal erosion and the increase in ice-free “fetch” which allows larger waves to form.[14] I saw this first-hand on August 27 in Barrow: as the 45 mph+ winds were howling onshore, the Arctic Ocean was making significant progress in overtaking roads and buildings. I counted at least a dozen separate crews from the North Slope Borough with bulldozers and front loaders attempting to mound up dirt in an ambitious attempt to hold back the sea. It was troubling to think that Barrow, one of the wealthiest communities in the Arctic (due to proceeds of North Slope oil development), was struggling this much. The impacts of flooding and erosion of the coastal shoreline are likely to be worse in other, less well-financed communities, as these phenomena occur throughout the circumpolar Arctic.
Another major area of change which can be observed throughout the Arctic is the thawing of permafrost at a much higher rate than it is created. At many places in my expedition, there was substantial thermokarst, which is a land-surface configuration that results from the melting of ground ice in a region underlain by permafrost. In areas that have appreciable amounts of ice, small pits, valleys, and hummocks are formed when the ice melts and the ground settles unevenly.[15] Scientists at the Cold Regions Research and Environmental Laboratory (CRREL) permafrost tunnel in Fox, Alaska and elsewhere have observed the accretion and depletion of permafrost, and I had a chance to visit this site.

Fig. 5 Thawing permafrost. Datasource: Impacts of a Warming Arctic: Arctic Climate Impact Assessment. ACIA Overview report. Cambridge University Press. 140 pp.
Finally, the most closely associated variable in a changing climate is the overall increase over the long term in surface temperatures. While temperatures will vary with weather and specific location, a changing climate means that the overall long-term trend will be for an increase in the global average temperature. While I was in Deadhorse, Alaska on June 21, 2015, the temperature rose to 82 degrees Farenheit.[16] This is the second-highest temperature on record for that location, which averages high temperatures on that date of 48 degrees.[17] Of course, it is not possible for one individual to directly observe global average temperatures, but the staggering heat that day allowed me to experience what Arctic warming could feel like.
In conclusion, just a short period of time spent in the Alaska Arctic gave me the opportunity to see firsthand significant environmental phenomena which have been tied to a changing climate. These anecdotes are vivid and memorable, though not as robust as the systematic observations of trends over time across a broad geography. Nonetheless, what I saw is clear evidence that more research needs to be done, so that we can reliably say what the changing Arctic is going to resemble.
*The Dalton Highway, running from near Livengood to Deadhorse, Alaska, provides the best road access to a transect of Arctic vegetation subzones C,D,E and boreal forest.[10]
†Aufeis is a sheet of ice that forms via the accumulation of successive layers of frozen groundwater flows. The layers often appear laminated in cross-section.
References
1. Climate Frontlines [Internet]. UNESCO. [cited 2015 Dec 4]. Available from:http://www.climatefrontlines.org/
2. Chapman W. 2015. Why the Arctic is climate change’s canary in the coal mine. TED Ed [Internet] [cited 2015 Dec 4]. Available from:http://ed.ted.com/lessons/why-the-arctic-is-climate-change-s-canary-in-the-coal-mine-william-chapman#review
3. Polar Research Board. 2015. Arctic Matters: The Global Connection to Changes in the Arctic. Washington (DC): National Academies Press.
4. Pithan F, Mauritsen T. 2014. Arctic amplification dominated by temperature feedbacks in contemporary climate models. Nature Geoscience 7: 181-184.
5. Screen JA, Simmonds I. 2010. The central role of diminishing sea ice in recent Arctic temperature amplification. Nature 464: 1334-1337.
6. Stroeve J, Holland MM, Meier W, Scambos T, Serreze M. 2007. Arctic sea ice decline: Faster than forecast. Geophysical Research Letters 34(9): GL029703.
7. Jiang Y, Dixon TH, Wdowinski S. 2010. Accelerating uplift in the North Atlantic region as an indicator of ice loss. Nature Geoscience 3: 404-407.
8. Hollesen J, Matthiesen H, Moller AB, Elberlin B. 2015. Permafrost thawing in organic Arctic soils accelerated by ground heat production. Nature Climate Change 5: 574-578.
9. Arctic Alaska Environmental Change Field Course, June 2015, Fairbanks [Internet]. Fairbanks (AK): University of Alaska Fairbanks; [cited 2015 Dec 4]. Available from: http://www.uarctic.org/news/2015/2/arctic-alaska-environmental-change-field-course-june-2015-fairbanks/
10. Walker DA, Raynolds MK, Daniels FJA, Einarsson E, Elvebakk A, Gould WA, Katenin AE, Kholod SS, Markon CJ, Melnikov ES, Moskalenko NG, Talbot SS, Yurtsev BA, et al. 2005. The Circumpolar Arctic vegetation map. Journal of Vegetation Science 16(3): 267-282.
11. Andrews L. 8 April 2015. Dalton Highway ‘an ice sheet’ as Alaska Gov. Walker declares disaster. Alaska News Dispatch. [Internet] [cited 2015 Dec 4]. Available from: http://www.adn.com/article/20150408/dalton-highway-ice-sheet-alaska-gov-walker-declares-disaster
12. Eicken H, Shapiro LH, Gaylord AG, Mahoney A, Cotter PW. 2009. Recurring Spring Leads and Landfast Ice in the Beaufort and Chukchi Seas, 1993-2004. Boulder (CO): National Snow and Ice Data Center.
13. Barrow Sea Ice Webcam [Internet]. Fairbanks (AK): University of Alaska Fairbanks; [cited 2015 Dec 4]. Available from:http://seaice.alaska.edu/gi/observatories/barrow_webcam
14. Struzik E. 2011. As Arctic Sea Ice Retreats,Storms Take Toll on the Land. Yale Environment 360 [Internet] [cited 2015 Dec 4]. Available from:http://e360.yale.edu/feature/as_arctic_sea_ice_retreats_storms…
15. Thermokarst [Internet]. Chicago (IL): Encyclopedia Britannica; [cited 2015 Dec 4]. Available from: http://www.britannica.com/science/thermokarst
16. As warm summer continues, Deadhorse ties record high temperature [Internet]. 2015. Anchorage (AK): Alaska Dispatch News; [cited 2015 Dec 4]. Available from: http://www.adn.com/article/20150622/warm-summer-continues-deadhorse-ties-record-high-temperature
17. Average Weather In June For Deadhorse, Alaska, USA [Internet]. San Francisco (CA): Weatherspark; [cited 2015 Dec 4]. Available from:https://weatherspark.com/averages/33051/6/Deadhorse-Alaska-United-States